

If you have tried to work out what your television costs to run, you have probably met three different numbers and no explanation of how they relate.
The spec sheet says something like “≤150 W”. The energy label says “80 kWh/1000h”. A comparison site says “most TVs use 50 to 200 watts”. All three are correct. None of them answers the question on its own, and two of them are routinely quoted as if they meant something they do not.
This guide is written from the manufacturer’s side of that spec sheet. It explains what each figure measures, which one you actually want, where to find it, and how to convert it into money.
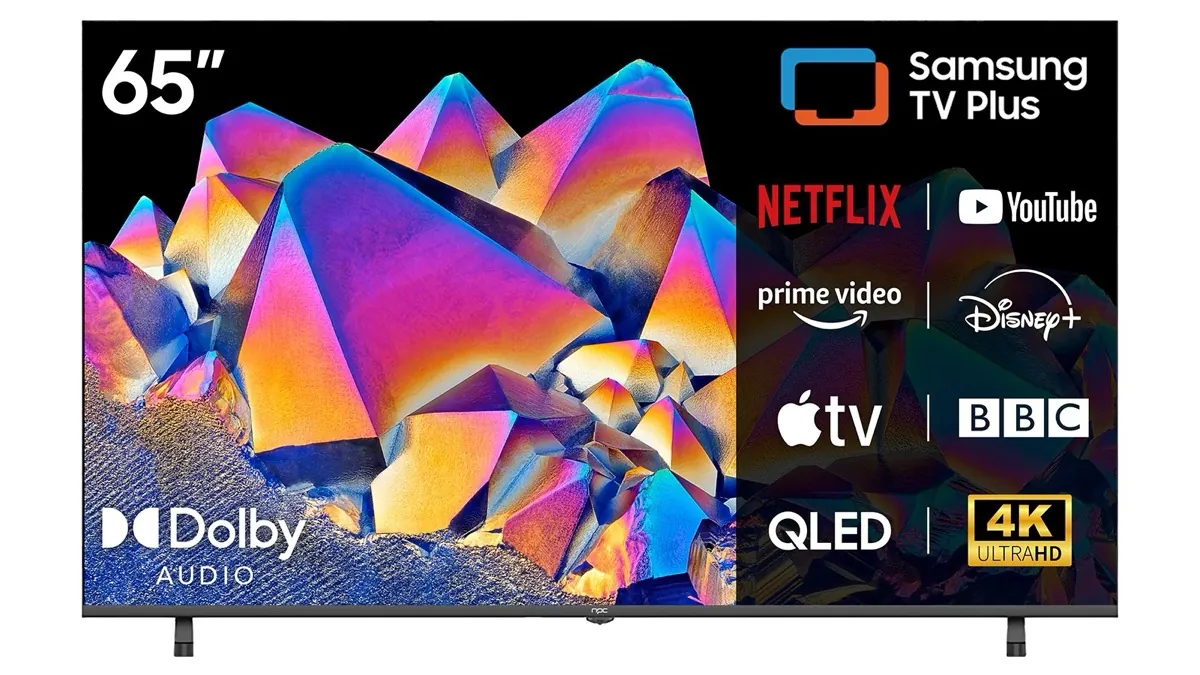
Three Numbers, Three Different Meanings
Rated maximum power — the number on the spec sheet
This is the figure you will find in many product specification tables, often written with a “≤” in front of it.
It is an upper bound, not a typical-use measurement. It describes the maximum on-mode input power declared for that product under its applicable test or operating conditions. It is useful for electrical planning and product compliance, but it is not what the television necessarily draws while you watch a film.
How far apart can the numbers be? The comparison below sets NPC-listed on-mode upper bounds against commonly cited approximate 2023 UHD reference ceilings. The ratio is between 1.6× and 3.5× in these examples, but the two columns are not the same kind of measurement.
| Screen size | NPC model example | NPC-listed on-mode upper bound | Approx. EU 2023 4K reference* | Ratio |
|---|---|---|---|---|
| 55″ | XU55WD240N | ≤150 W | ~84 W | 1.8× |
| 65″ | XU65WD240N | ≤180 W | ~112 W | 1.6× |
| 75″ | XU75TZ210N | ≤500 W | ~141 W | 3.5× |
For a 16:9 UHD television, the 75-inch example is commonly shown as roughly a 141 W 2023 reference ceiling. The regulation itself is area- and resolution-based and includes defined measurement conditions and allowances, so do not treat 141 W as a universal fixed limit for every 75-inch display. Quoting an NPC nameplate ceiling as a running cost would still overstate consumption in many cases.
Standby power — real, and smaller than you think
Modern sets are often rated at ≤0.5 W in standby, and that is a declared upper bound rather than a typical-use estimate. EU ecodesign rules set a 0.50 W standby maximum and a 2.00 W networked-standby maximum, subject to defined allowances; these are separate modes.
At 0.5 W, leaving a television on standby for an entire year costs 4.4 kWh — about £1.15 in the UK or $0.80 in the US. Switching your TV off at the wall saves roughly one pound a year. The “vampire load” stories are not wrong that standby exists; they are wrong about the scale, at least for televisions.
Energy label consumption — the number you actually want
Televisions within the scope of EU energy-labelling rules carry an energy label reporting consumption in kWh per 1000 hours of viewing, measured under a defined test procedure. Since March 2021 the label reports SDR and HDR separately, each with its own A–G class.
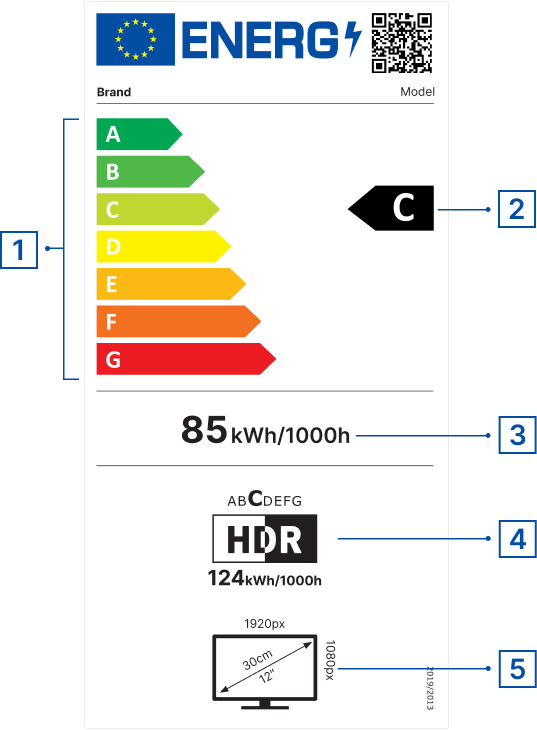
This is the measured, comparable, regulated figure. It is the one to use.
The Trick Nobody Mentions
Here is the part that makes the label immediately useful.
kWh per 1000 hours and average watts are the same number.
A label reading 80 kWh/1000h means the set draws 80 W on average across the test content. The arithmetic is trivial once you see it: 80 kWh over 1000 hours is 80,000 Wh ÷ 1000 h = 80 W.
So when you read “80 kWh/1000h” you can simply say “80 watts” and carry on. No conversion, no calculator. That single fact turns the energy label from an abstract compliance sticker into the most directly useful spec on the box — and it is why the label figure, not the spec sheet figure, belongs in any running-cost calculation.
Where to Find the Real Figure
On the energy label itself. In the EU and UK, the label is displayed on the product page and in store. Look for the kWh/1000h figure, and note there are two of them — SDR and HDR.
In the EPREL database. Every model sold in the EU is registered in the European Product Registry for Energy Labelling at eprel.ec.europa.eu. Search the model number and you get the official registered figures, including both SDR and HDR consumption and both energy classes. This is the authoritative source, and it covers models regardless of what the retailer chose to publish.
Outside the EU and UK, requirements vary: some markets use their own mandatory labels or voluntary programmes, while others do not use the EU format. Do not assume that a regional model suffix, panel or backlight is identical across markets; match the exact model and regional documentation. If no comparable label is available, the measurement method in Section 5 is your fallback.
Real figures from the register
Four model- and region-specific EU energy-label examples, cross-checked against EPREL records and manufacturer label PDFs:
| Model | Size and panel | SDR | Class | HDR | Class |
|---|---|---|---|---|---|
| LG OLED42C44LA | 42″ OLED | 52 W | G | 90 W | G |
| LG OLED55C52LA | 55″ OLED | 77.4 W | F | 191 W | G |
| Samsung UE55DU7100K | 55″ LED LCD | 80 W | G | 121 W | G |
| LG OLED65G51LW | 65″ OLED | 84.6 W | E | 222 W | G |
Two things stand out. The SDR figures cluster between 52 W and 85 W across sizes from 42 to 65 inches — a much narrower band than the “50 to 200 watts” you see quoted. And the HDR figures do not cluster at all.
Turning Watts Into Money
The formula is short enough to do in your head:
Annual cost = watts ÷ 1000 × hours per day × 365 × price per kWh
Four hours a day for a year is 1,460 hours, so a convenient shortcut is to multiply the label figure by 1.46 to get annual kWh.
Rates used below: UK 26.32p/kWh (Ofgem average electricity unit rate for standard variable tariffs paid by Direct Debit, 1 October to 31 December 2026, England/Scotland/Wales) and US 18.34¢/kWh (EIA residential average, June 2026, the latest monthly value in the cited table at this fact-check date). Substitute your own rate — it is the input that varies most.
Annual running cost at four hours a day
| Model | SDR kWh/yr | UK | US | HDR kWh/yr | UK (HDR) |
|---|---|---|---|---|---|
| 42″ OLED | 75.9 | £19.98 | $13.92 | 131.4 | £34.58 |
| 55″ OLED | 113.0 | £29.74 | $20.72 | 278.9 | £73.40 |
| 55″ LED LCD | 116.8 | £30.74 | $21.42 | 176.7 | £46.50 |
| 65″ OLED | 123.5 | £32.51 | $22.65 | 324.1 | £85.31 |
Worked example. A 65-inch OLED at 84.6 W, watched five hours a day, using the cited Ofgem average UK unit rate:
84.6 ÷ 1000 × 5 × 365 = 154.4 kWh × £0.2632 = £40.64 a year.
For the four examples above, four hours a day of SDR viewing works out at roughly £20–£33 a year at the cited UK unit rate. That is an example range, not a universal household average: screen settings, content, viewing hours and the tariff all change the result.
HDR Is the Figure People Miss
Look again at the table above. The 65-inch OLED draws 84.6 W in SDR and 222 W in HDR — 2.6 times as much. Across the four models the HDR multiplier runs from 1.5× to 2.6×.
That is the single largest variable in the whole calculation, and it is invisible on any spec sheet that quotes one number.
The reason is straightforward. HDR content is graded for much higher peak brightness, so the backlight — or, on an OLED, the panel itself — runs far harder in specular highlights. The set is doing what it is supposed to do; it just costs more to do it.
What this means in practice:
If you watch mostly broadcast TV, streaming in SDR, or gaming in SDR, use the SDR figure. It is representative.
If you watch HDR films most evenings, your real annual figure sits somewhere between the two, closer to the HDR number the more you watch.
In this small sample, the three OLED examples have larger SDR-to-HDR ratios than the one LED LCD example. That is a sample observation, not a technology-wide rule.
None of this is an argument against HDR. It is an argument for knowing which number you are quoting.
Measuring Your Own Set
If your model is not in EPREL, or you want the figure for your actual settings rather than a standard test, measure it. A plug-in energy monitor costs very little and takes ten minutes.
Plug the monitor into the wall, and the television into the monitor.
Note the standby reading with the set switched off. Expect well under 1 W.
Switch on and let the picture settle for two or three minutes — power draw fluctuates for the first moments after start-up.
Play typical content at your normal brightness setting and note the reading. It will move with scene content; take a rough average over a minute rather than a single instant.
Repeat with an HDR title if you watch HDR.
Repeat with the brightness at maximum, then at your usual level, to see what that setting alone costs you.
That last comparison is usually the most revealing thing in the exercise.
What Actually Changes the Number
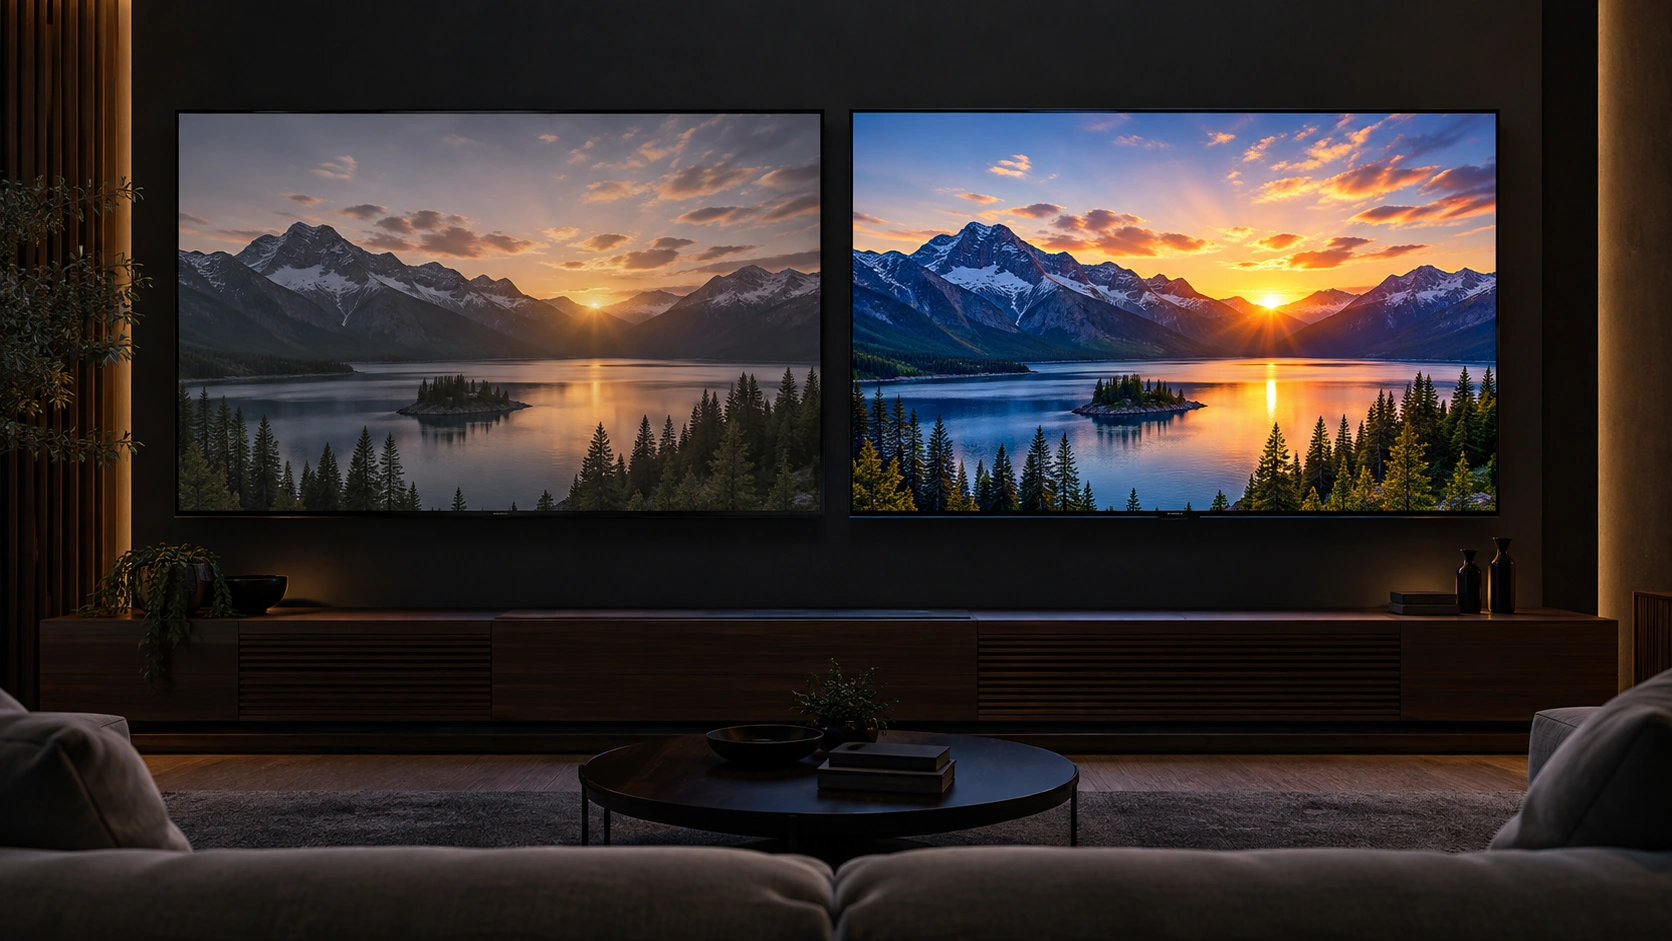
Brightness is usually the biggest controllable factor. Backlight or panel luminance is a major term in TV power draw. Dropping the backlight from maximum to a comfortable evening level can cut consumption substantially, although the exact change depends on the display technology and picture mode. If you want the television to use less power, this is the first control to test.
Content type. HDR against SDR, as above: 1.5× to 2.6×. Bright content draws more than dark content on an OLED, where black pixels are genuinely off. On an LED LCD with a full-array backlight the effect is real but smaller, because the backlight is on regardless.
Screen size, less than you would assume. The SDR figures above run 52 W to 85 W between 42 and 65 inches. Size matters, but a large modern set at a sensible brightness draws less than a smaller older one at maximum.
Local dimming. Zone dimming reduces power in dark scenes by switching backlight zones down. The effect varies by content and is generally modest against the brightness setting.
Eco and ambient-light modes. These adjust brightness automatically to the room. They work, for exactly the reason above. Whether you like what they do to the picture is a separate question.
Standby, barely. About £1 a year. Worth switching off at the wall if it is convenient; not worth rearranging your living room for.
FAQ
How many watts does a 55-inch TV use?
In the two named examples, the SDR label figures are 77.4 W and 80 W — around 80 W is a reasonable working number for that small sample. In HDR the same labels show 121 W and 191 W. The “≤150 W” style figure on a specification sheet is a rated maximum, not consumption.
Is it cheaper to leave the TV on or switch it off?
Switch it off. There is no warm-up penalty on a modern television. Standby costs roughly 4.4 kWh a year at 0.5 W, so switching off at the wall rather than using standby saves about £1 annually — real, but small.
Does Mini LED use more power than standard LED?
It can, because Mini LED backlights are built for higher peak brightness and are usually paired with HDR content that drives them hard. In SDR at a matched brightness level the difference is much smaller. Compare the SDR energy-label figures for the specific models rather than reasoning from the backlight type.
What does running a TV for 24 hours cost?
At 80 W, 24 hours is 1.92 kWh — about 51p in the UK or 35¢ in the US at current average rates. A television left on continuously for a year would cost roughly £184 or $128.
Why is my new TV rated F or G when my old one was A+?
The EU rescaled the labels in March 2021 and moved covered displays to the simpler A–G scale, removing the old A+, A++ and A+++ classes. The new scale is stricter and an old rating does not translate directly to a new one. It reflects a changed ruler, not necessarily a sudden collapse in efficiency.
Where do I find my TV’s real consumption figure?
The EU energy label, or the EPREL database at eprel.ec.europa.eu using the model number. Look for kWh/1000h, and remember that figure is also the average wattage.
Conclusion
Three numbers, three jobs. The spec sheet figure sizes the power supply. The standby figure is real and worth about a pound a year. The energy label figure — kWh per 1000 hours, which is also just watts — is the one that answers what your television costs to run.
Read the label, multiply by 1.46 for four hours a day, and multiply by your tariff. For the four examples in this article, standard-viewing costs at that UK rate are roughly £20–£33 a year; the largest variable you can usually control is the brightness setting.
Browse NPC’s TV range, including full specifications for every model, on the Tizen OS TV category page.